

T S Ahluwalia, Convenor of Ports & Logistic Committee and President, NISA, drills down into the logistics cost structure of shippers to point out several anomalies that need to be set right
Even though the government has granted Infrastructure status to logistics, still the industry is chasing to find the actual logistics cost which is high for both imports and exports making them uncompetitive in the global markets. The government is aiming to reduce logistics cost to less than 10 per cent by 2022 but until digitalization gets implemented in every vertical of the logistic value chain along with elimination of unnecessary intermediaries, it will be a herculean task to achieve. India’s logistics cost has been standing high, making products costlier. The reason behind different views and approaches in calculating logistic cost value is the many intermediaries involved in moving cargo. It could be difficult to bring together for calculating all the variable cost components involved in it. The industry has given enormous impetus to the intermediary service providers who impose high charges that ultimately need to be borne by the shippers.
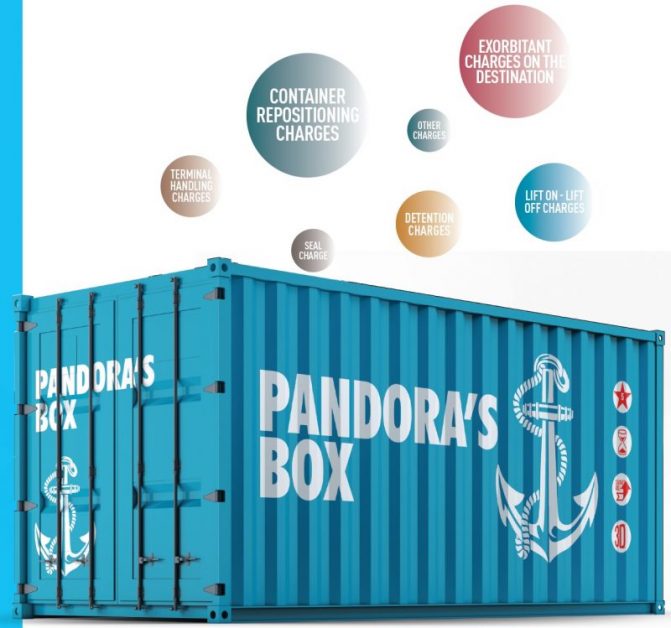
Terminal handling charges (THC): THC for export shipments pertain to the handling of the container at the terminal, i.e., the movement of the container from container yard till it is loaded on the vessel. This handling is done by the terminal and charges are levied to the shipping line which are collected by the lines from the exporter.
It may be mentioned that for all major ports, all kinds of charges are governed by TAMP. It has been reported that in some cases, shipping lines in their invoice to exporters have charged THC which are as much as 80 per cent to 90 per cent higher than what is being charged by the terminal. For e.g. the charges published by JNP on their Website for moving normal/ reefer container from ship to container yard or vice versa is Rs 3,094/- for loaded and Rs 2,499/- for empty per teu. Against this, the amount charged by shipping lines are higher. For e.g the THC at JNP terminals is Rs 7,000/-. Similarly, Terminal handling charges at Cochin Port vary from one shipping line to another for export and import. The difference in this segment is as high as Rs. 1200/- for a container is the case for other shipping lines.
The THC is fixed by TAMP and handling of containers is done by respective terminals, so shipping lines or any intermediaries have no right to add any extra charges. There has to be complete transparency and each port should display THC promptly on their website.
In the absence of uniform THC, it becomes difficult for an exporter to keep track of the charges and hence can become vulnerable to higher charges while dealing through an intermediary. Similarly, at non-major ports too, exporters have faced similar issue. For e.g in one of the cases, an exporter was required to pay a THC of Rs 13,900/-per container.
Sea freight charged by shipping lines: Shipping lines are charging freight with higher Dollar to Rupee conversion rate. For examples if one Dollar equals `71, shipping line’s may be charging one Dollar @Rs 73 0r 73.50.
General Rate Increase (GRI): It is noticed that whenever Indian export witness slight increase; shipping line’s bring in GRI. Sea freight is normally offered on monthly basis which prevents Indian exporters to accept orders with longer delivery schedule.
Container repositioning charges: It is the duty of shipping lines to provide containers and other services where exporters need them.
Bill of lading charges
For any cargo, the carrier issues a receipt upon receiving the said goods and hence the following needs clarification:
- The reason for charging an amount for issuing a bill of lading which is actually a receipt of accepting the container for onward movement for which freight is already collected.
- Rationale of charging `3000/– `5000/- for issuing a bill of lading to exporters. Moreover, every shipping line has their own charge which again creates a lot of confusion for an exporter.
- It has been reported that whenever exporters seeks clarification on any charges being levied by shipping lines, they hardly get any clarification and moreover are imposed with late BL charges which appears to be unjustified. The trade feels this practice of late BL charges should be immediately stopped. Lack of uniform practices in bill of lading issuance, as few shipping lines issue the same based on SWIFT remittance when payment is being made in USD, while few wait for the actual credit of the account.
Seal charge: Shipping agents and shipping lines are charging Rs.300 to Rs.700 for a Seal, whereas the actual cost of a seal is less than Rs.50/-.
Lift on – Lift off charges: Providing containers to the shipper for stuffing of cargo is the basic responsibility of the shipping line. Therefore, lift on-lift off charge is unjustified. The shipping lines may take necessary action about it. At Kolkata Port, the shipping line issues a D.O. (Delivery Order) which mentions the name of the nominated container yard from where the empty boxes need to be picked up for export. Now, in-order to lift the empty containers from the container yard, the shipper has to pay lift on-lift off charges (popularly known as plot charges) in Kolkata. At present, lift on-lift off charges are Rs 3,000 per 40-foot container. This charge of Rs 3,000 per container is sometimes more than the ocean freight being paid to the shipping line. Similarly, higher charges were levied at Mundra Port initially and since now the port has become well established, the amount should be revised. Presently, the charges are around Rs 2000/- at this port and since it is doing remarkably well, it can offer better services and rates to North Indian exporters.
Detention charges: Exporters are being penalized with demurrage/detention in spite of no fault on their part. Hence, clarification is required keeping in view the international practices in this regard. Often, Shipping lines do not accept the ‘Via facility’ to facilitate loading on vessel in spite of arrival of containers before the stipulated time for Via facilities. Moreover, lines also charge detention from the date of picking containers to sailing date for next vessel without even offloading the normal time allowed without penalty for pickup and handover. The charge logically should have been only between date of arrival of containers from gate shut off to gate reopening at port.
Other charges: Similarly there are other charges wherein CHAs also over charge exporters due to no transparency. Since freight is from container yard to container yard (CY-CY), hence the THC is responsibility of shipping lines so there should be one freight (all inclusive). Sri Lanka and Bangladesh follow a similar policy.
On the import side
Inland haulage charges: Shipping lines are charging higher inland haulage charges for import containers towards movement from gateway ports to hinterland ICDs. There is a need for shipping lines to charge the inland haulage charges rationally and uniformly. Further, other charges to be collected on account of BL discharge, delivery order release, container cleaning charges should be laid down before hand on BL and should be available for information of the importer to avoid complaints of possible over charging at delivery stage. Multiple containers under one B/L are brought in parts to the ICD’s from gateway port resulting in demurrage and detention. Multiple containers under one B/L should be brought together to the ICD’s to avoid delay in clearance and payment of unnecessary charges.
Exorbitant charges on the destination: At the time of clearance, shipping lines charge importers exorbitantly on the destination charges. To resolve shipping related issues and reduce the logistic cost, the Indian government under the Ministry of Commerce has created Logistic Division. Presently Special Secretary Mr Sivasailam is heading this division and working very hard to cut the logistic cost which is important to make Indian exports competitive. The MMTG ACT is also modified and awaiting approval from the Parliament.
Has Cabotage relaxation brought relief to shippers?
For decades there has been a debate about the relaxation of Cabotage Law in India. It has often been referred to as the law to protect India’s domestic coastal shipping businesses from foreign competition by heavily taxing imports. As per estimates, the operating costs for Indian shippers are about 20 per cent higher than for foreign lines because of the higher cost of funding, fuel, training costs, wages tax, GST, etc. Foreign flagged ships that operate in Indian waters benefit from lower costs in the country of registration, allowing them to offer tariffs much lower than their Indian counterparts.
In May 2018, the government of India finally relaxed the Cabotage laws enabling the foreign-flagged vessels to carry coastal cargo in India. In spite of the positive progress, there has been a continuous debate over the effects of relaxation of Cabotage Policy, arguing that private ports have gained more benefits than their publicly-run counterparts. Minor ports have the benefit of unregulated tariffs and superior infrastructure, whereas major ports have been handicapped by tariff regulations and reasonably lower efficiency and competence. Thus, for enhancing the potential of existing domestic players like domestic port trusts and Indian ship-owners, it is necessary for removing taxes on marine fuels.
Another major concern has been the availability of cargo. The current Indian Coastal Cargo mainly consists of petrol, oil lubricants (POL), iron ore, pallets etc besides coal and fertilizers which are primarily for the use of Public Sector Undertakings. There is scope for more cargo consisting of industrial and finished products like steel, tiles, car, cement and also marble, fertilizers and food grains from the west coast. On the east coast bulk cargo can include silica, bauxite, manganese, limestone, cars and engineering good from the south. The scope for coastal shipping of containerized cargo including the international feeder operations is assessed to be around $500 million in value with a volume of 1.3 million teu every year and with an annual growth of over 20 per cent.
The logistics cost also needs to be cut down substantially in India to make the trade competitive and for the purpose, there is a need for greater investment in coastal shipping and strengthening infrastructure for inland transport of cargo.
The Government of India is in the process of formulating a National Logistics Policy aimed at ensuring seamless movement of goods across India and reducing high transaction cost to traders. Ministry of Commerce & Industry has also commenced an exercise to develop a sector-specific index to estimate the logistics costs and bring them down to 10 per cent of the gross domestic product (GDP) from 14 per cent at present as they are higher than those in developed countries.
The government also aims to enter the list of top 30 countries in the World Bank Logistics Performance Index which ranked India at 44th position in 2018 from 54th in 2014.
Thus, the logistics sector’s growth is critical to boost exports and economic growth. FIEO has also been working with Logistics Division, Department of Commerce towards facilitating ease of doing business and reducing logistics cost in India. Various initiatives taken by FIEO include organising stakeholder consultations at various major seaports and airports, conducted dwell time analysis at various port of India and recently a trade notice has been released emphasising on Standard Operating Procedure (SOP) for payment of freight and freight related charges for exports.
The very recent development: Indian railway has invited FIEO to look into possibilities to revise (reduce) the rail freight for rice exports.

“A large number of the country’s industrial clusters (dominated mainly by MSMEs) are based out of its tier 2 cities, and not in its large metros, the last mile connect has been throttling the growth of Indian MSMEs.”
As an agri-commodity exporter what challenges do you face right from procurement, warehousing, and logistics till your exports reach the port and are loaded onto the ship?
Agricultural export constitutes 10 per cent of the country’s exports and is the fourth-largest exported principal commodity. The agro industry in India is divided into several sub segments such as canned, dairy, processed, frozen food to fisheries, meat, poultry, food grains etc. However, in the global trade, the share of India is only close to 2 per cent. To achieve the true potential and export a greater share of what is being produced in India, there is an immediate need to address the export challenges.
Procurement
The backward linkages need to be strengthened not only to boost the Indian exports, but also to reduce wastages at the farm level. Currently the wastages account for: F&V- 4.6 -15.9 per cent; inland fish – 5.2 per cent; marine fish -10.5 per cent, meat – 2.7 per cent; poultry- 6.7 per cent. The state governments need to come forward and proactively assist the exports from their respective states.
As per Agricultural ministry, `50,000 worth of agriculture produce is wasted every year. New challenges have developed in exports by increasing MSP to support income to the farmers. This lead to fall in export of many Indian agricultural commodities like rice, wheat, barley etc.
Training and skill development at farm level
- Unregulated input (chemicals) usage at the farm level, Inadequate harvest and post-harvest management affects quality and shelf life of the produce
- Region and commodity specific packaging practices need to be developed and disseminated to the last mile.
- Farmer awareness is critical to regulate the chemical usage on the farm.
- Major thrust should be on value added products
Infrastructure
More than 30 per cent of the produce from farm gate is lost due to inadequate cold chain infrastructure (covering only 1 per cent of total F&Vs production) and inadequate logistics. About 80 per cent of the 217 lakh tonnes cold storage capacity is engaged by potatoes while other F&Vs account for only 0.2 per cent.
The food processing industry has a high concentration of unorganised segments, representing almost 75 per cent across all product categories. Thus, the inefficiencies in the existing production system can be attributed to the incapacity of small regional players to invest in technology upgradation and diversify into alternate product categories.
Training and skill development at exporters’ level
- Documentation and procedures to be followed for exports
- Lack of awareness on existing schemes and policies related to exports.
- Fast tracking on frequently changing MRL issues
Logistics
Instead of using specialised transportation for perishables like reefer vans, the logistics predominantly rely on traditional modes, commonly used for grains. The connectivity of the landlocked production areas to the ports or terminals is a stiff challenge. E.g. Bihar, Jharkhand, North-eastern states and hilly regions like Himachal Pradesh, Uttarakhand and J&K. Also, the link roads from farms to the main road is underdeveloped in most of the states. Congestion at the ports due to high waiting periods of the shipment is a problem. Most exporters reported about the congestion at JNPT.
How have been the Indian agri-commodity exports during the recent past? What are the measures being taken to increase Indian agri-exports? What can we expect in future?
There has been 3 per cent growth in India’s exports of agri and allied commodities in 2018-19, as compared to last fiscal year. The growth is driven by double digit growth in mollases, sugar, dairy products etc.
The top commodities registering double digit growth (more than 10%) in 2018-19.
| Apr-Mar 2018 | Apr-Mar 2019 | %Growth | |
| Values in USD Mn | |||
| Mollases | 15.06 | 83.79 | 456.22 |
| Other meat | 1.09 | 1.96 | 80.14 |
| Sugar | 810.9 | 1,360.29 | 67.75 |
| Dairy products | 303.05 | 481.55 | 58.9 |
| Other cereals | 248.59 | 348.97 | 40.38 |
| Oil meals | 1,093.16 | 1,508.65 | 38.01 |
| Animal casings | 50.68 | 68.27 | 34.71 |
| Processed meat | 1.54 | 2 | 30.3 |
| Niger seeds | 10.84 | 13.64 | 25.88 |
| Vegetable oils | 87.83 | 106.79 | 21.59 |
| Tobacco manufactured | 340.37 | 411.04 | 20.76 |
| Fruits / vegetable seeds | 104.04 | 124.92 | 20.08 |
| Misc processed items | 550.55 | 659.18 | 19.73 |
| Sesame seeds | 463.9 | 538.96 | 16.18 |
| Poultry products | 85.7 | 98.15 | 14.53 |
| Pulses | 227.75 | 259.35 | 13.87 |
| Rice-basmati | 4,169.56 | 4,712.44 | 13.02 |
| Milled products | 136.01 | 151.86 | 11.66 |
| Agri & allied products | 27,778.34 | 28,615.65 | 3.01 |
Measures taken to increase agri exports
The government has formulated a comprehensive Agriculture Export Policy to consolidate the efforts for export of agricultural products. Assistance to the exporters of agricultural products is also available under the Export Promotion Schemes of Agricultural & Processed Food Products Export Development Authority (APEDA), Marine Products Export Development Authority (MPEDA), Tobacco Board, Tea Board, Coffee Board, Rubber Board and Spices Board. These organisations also seek to promote exports through participation in international fairs & exhibitions, taking initiatives to gain market access for different products in different markets, disseminating market intelligence and taking steps to ensure quality of exported products.
Government of India announces Minimum Support Prices (MSPs) for 22 mandated crops and Fair and Remunerative Price (FRP) for sugarcane to ensure that the farmers get remunerative price for their produce.
What can be expected in future?
The target of reaching agri exports to $60 billion by 2022 looks achievable as India’s export basket largely comprises meat, marine products, and basmati rice whose demand in the world market is on a constant increase. The share of high-value and value added products is less than 15 per cent, compared to 25 per cent in the US and 49 per cent in China. The focus should be now on exporting processed food products, which can fetch high value in global markets.
Currently, Indian organic agricultural products market is about Rs 8500 crores. Exports account for nearly 60 per cent at 5,150 crore while domestic market is estimated at `2500 crore. Compared to international trade of about $97 billion Indian market seems to be very small but it is growing very fast. In order to promote exports of organic products, state governments should align their organic production programme with products that have export potential. Most of the countries try their level best to protect their own farming sector and thus try to restrict imports by using all kind of protections available in WTO Agreement.
Can you briefly explain the north India exim trade landscape? Which are the cargo clusters and which are the commodities being exported and imported and through which ports?
Indian logistics landscape, typically comprises of isolated entities, with a skewed modal mix that depends heavily (about 60 per cent) on the already congested Indian roads. Industries in North Indian states have a natural disadvantage against coastal states of Tamil Nadu, Andhra Pradesh, Maharashtra and Gujarat as those can import raw materials at better international prices and export too. Smaller firms in northern India are most affected because compared to their larger counterparts, they cannot relocate to states which have a more efficient infrastructure network.
A large number of the country’s industrial clusters (dominated mainly by MSMEs) are based out of its tier 2 cities, and not in its large metros, the last mile connect has been throttling the growth of Indian MSMEs. For instance, be it Kishangarh (in Rajasthan, touted to be Asia’s largest marble market), or Agra and Kanpur- country’s leather hubs, or for that matter, Moradabad (known for brass exports), Firozabad (known for glassmaking industry) or textile hubs of Tirupur, Erode, Karur, Salem – are all based out of India’s tier-2 regions. Such regions have been plagued with issues of access and reach.
Top 7 north Indian ports contribute to 7% in India’s exports.
| North India Ports | Exports in 2018-19 (US$ Bn) | %Share in India’s exports 2018-19 |
| Delhi AIR | 12.36 | 3.75% |
| Delhi (ICD) | 5.57 | 1.69% |
| CFS Albatross/ICD Dadri | 1.52 | 0.46% |
| ICD Garhiharsaru | 1.37 | 0.42% |
| ICD Noida-Dadri | 1.10 | 0.33% |
| ICD Sahnewal, GRFL | 1.08 | 0.33% |
| ICD Faridabad | 1.08 | 0.33% |
| Sub total | 24.10 | 7.30% |
| India’s total exports | 330.08 |
Top 5 export commodities: Delhi AIR
| Commodity | Exports in 2018-19 (US$ Mn) | share |
| Electric machinery and equipment* | 2918.54 | 23.60% |
| Petroleum products** | 1012.63 | 8.19% |
| Gold | 902.37 | 7.30% |
| RMG manmade fibres | 867.58 | 7.02% |
| RMG cotton incl accessories | 761.90 | 6.16% |
*Mobil phones ** Turbine fuel
Top 5 export commodities: Delhi ICD
| Commodity | Exports in 2018-19 (US$ Mn) | share |
| RMG manmade fibres | 889.74 | 15.96% |
| RMG cotton incl accessories | 571.26 | 10.25% |
| RMG of other textile material | 436.52 | 7.83% |
| Auto components/parts | 371.18 | 6.66% |
| Products of iron and steel | 251.42 | 4.51% |
Top 5 export commodities: CFS Albatross/ ICD Dadri
| Commodity | Exports in 2018-19 (US$ Mn) | share |
| Buffalo meat | 808.65 | 53.14% |
| Indl. machnry for dairy etc | 92.41 | 6.07% |
| Products of iron and steel | 61.21 | 4.02% |
| Cotton fabrics, madeups etc. | 52.18 | 3.43% |
| Carpet(excl. silk) handmade | 51.05 | 3.35% |
Top 5 export commodities: ICD Garhiharsaru
| Commodity | Exports in 2018-19 (US$ Mn) | share |
| Two and three wheelers | 189.74 | 13.81% |
| Other misc. engineering items | 174.62 | 12.71% |
| Iron and steel | 165.33 | 12.03% |
| Auto components/parts | 153.13 | 11.14% |
| Electric machinery and equipment | 78.64 | 5.72% |
Top 5 export commodities: ICD Noida
| Commodity | Exports in 2018-19 (US$ Mn) | share |
| Buffalo meat | 113.64 | 10.04% |
| Rice –basmati | 59.23 | 5.23% |
| Products of iron and steel | 54.44 | 4.81% |
| RMG manmade fibres | 54.43 | 4.81% |
| Agro chemicals | 50.21 | 4.43% |
Top 5 export commodities: ICD Sahnewal
| Commodity | Exports in 2018-19 (US$ Mn) | share |
| Products of iron and steel | 159.22 | 14.69% |
| Auto components/parts | 127.70 | 11.78% |
| Cotton yarn | 117.44 | 10.84% |
| Indl. machnry for dairy etc | 74.25 | 6.85% |
| Rice –basmati | 54.34 | 5.01% |
What are the logistics issues particular to north India? How is the last mile connectivity?
There is a need to make internal road transport more efficient. Though Octroi no more exists, but toll collection and barriers should be made efficient and smart. Toll expense form a sizeable expense of the transport community after fuel and with over 450 toll plazas sprung up across India, it can be on an average around `4 to 5 lakh per year for an exporter having 4-5 truck load in a month. The toll expenses incurred on the movement of export cargo are not refunded, hence it is included in the cost, thus, affecting our competitiveness. It is suggested that export cargo may be exempted from toll tax for such e-way bills which are meant for exports. To begin with, Factory stuffed, e- sealed containers may be facilitated with such exemption.
Movement of cargo from Delhi to Mundra, which is around 1200 kms consumes around 300 litres of diesel, the total cost shall be around `20,000 out of which duty sufferance would be approx. 40 per cent (`8,000). This makes the logistics of export goods costlier and affects the export competitiveness severely. Keeping the petroleum out the GST has defeated the purpose as substantial movement of export cargo inland is by road which costs heavily to the Indian exporter. It is therefore suggested that there is an urgent need to bring petroleum under GST. Introduction of GST has been a welcome step which will boost Indian exports as it provide refund of most of the taxes and levies at one place.
You also represent the MSME sector. What is the contribution of this sector to the Indian economy?
At present, MSMEs contribution to India’s GDP is around 29 per cent and government of India’s vision is to increase this share to over 50 per cent. This would further result in an increase in the share of MSMEs in India’s total exports to 75 per cent from 50 per cent at present. Also, it is estimated to increase the employment generation from current 11.10 crore to 15 crore people. Thus, the sector has a crucial role to play for making India a $5 trillion economy by 2024-25. The definition of MSME has been suitably amended but is yet to be recognised by the GOI.
What challenges do MSME face in procurement of raw material, production and in moving their production to the market?
Due to lack of technological adoption and upgradation, MSMEs in India face challenges with respect to meeting internationally accepted quality compliances, procuring or managing right resources, purchase of raw materials, supply chain management, integrating business rocesses, customer relations and satisfaction, investment in R&D, etc., thus making products and services of Indian MSMEs less globally competitive.
The major challenge in exports is the import of raw material on advance licence. Export period is small and imports take time. The solution – procure from Indian market on high price and export; doesn’t permit import after exports to balance the cost.
How can the MSME sector be made more competitive in the global market?
By creating awareness about international standards and global market demand; ensuring ease of export finance and facilitating better marketing abroad; encouraging investment and innovation via adopting latest technology. Further liberalising EXIM trade. Trade agreements with foreign nations need to be revised as trade under bilateral agreements do not remain in favour of India.
Maximum burnt to MSME is given by imports from China. This $50-60 billion (trade deficit) import should be replaced with Indian products/Make in India. In Indian Rupee it is a market worth `4,00,000 lakh crore. A simple replacement plan can create huge employment and save a lot of foreign exchange. This alone can revive Indian economy.