

The demand was predominantly driven by the manufacturing and 3PL sectors, together contributing 65% of the pie.
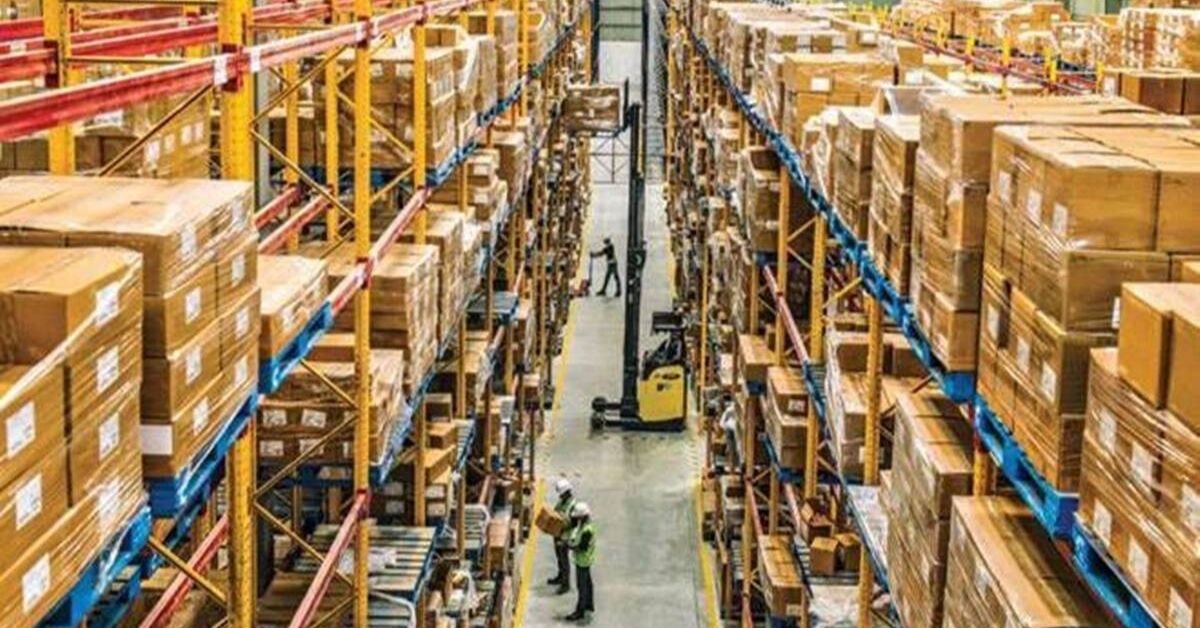
The industrial and logistics sector is witnessing significant growth both in terms of absorption and supply. In Q3 2023, the sector witnessed absorption of 11.4 mn sq. ft. Notably, tier I cities witnessed 78% of the absorption, while tier II and III cities accounted for the remaining 22%. The absorption is being led by a surge in demand from the manufacturing and retail sectors, as well as continued sustained demand from the 3PL sector, according to the latest report by Savills India, an International real estate advisory firm.
The report suggests that the sector witnessed a fresh supply of 17.8 mn sq. ft. in Q3 2023 of which 14.1 mn sq. ft. (79%) was from tier I cities and 3.7 mn sq. ft. (21%) from tier II and III cities. The surge in supply was due to the delivery of projects across the cities by major developers in response to growing demand.
Q3 2023 supply and absorption across cities
| Segment | Supply (mn sq. ft) | Absorption (mn sq. ft) |
| Overall | 17.8 | 11.4 |
| Tier I | 14.1 | 8.9 |
| Tier II & III | 3.7 | 2.5 |
| Segment | Supply (%) | Absorption (%) |
| Tier I (% of total) | 79% | 78% |
| Tier II & III (% of total) | 21% | 22% |
Note: Tier I city includes Ahmedabad, Bangalore, Chennai, Hyderabad, Kolkata, Mumbai, Delhi-NCR, and Pune. Tier II and tier III cities include Guwahati, Bhubaneshwar, Patna, Hosur, Coimbatore, Rajpura, Lucknow, Jaipur, Nagpur, Surat and Indore.
Q3 2023 grade wise supply & absorption
| Segment | Supply (%) | Absorption (%) | ||
| Grade A | Grade B | Grade A | Grade B | |
| Overall | 54% | 46% | 52% | 48% |
| Tier I | 62% | 38% | 54% | 46% |
| Tier II & III | 25% | 75% | 46% | 54% |
The overall grade A space accounted for 54% of the supply and 52% of the absorption in Q3 2023. However, in tier I cities, grade A space accounted for 62% of the supply and 54% of the absorption, indicating a significant increase in the supply and demand for graded and compliant buildings in tier I cities. The growing emphasis on EHS (Environmental, Health, and Safety) standards has led to increased demand for quality-compliant space from occupiers which will result in a transition from C and D grade spaces to grade A across the cities in the country in the coming years.
Q3 2023 sector wise absorption (%)
| Sector | Overall | Tier I | Tier II & III |
| 3PL | 32% | 26% | 54% |
| E-Commerce | 3% | 4% | 0% |
| Manufacturing | 33% | 33% | 32% |
| Retail | 16% | 19% | 8% |
| FMCG/FMCD | 5% | 5% | 6% |
| Others | 11% | 13% | 1% |
“The growing 3PL, manufacturing and retail sectors continue to drive the industrial & warehousing demand. Tier II and III cities are witnessing significant growth as prominent hubs for sourcing, consumption, and distribution. With developments such as industrial & dedicated freight corridors, inland waterways, along with improved infrastructure the sector is poised for exponential growth. We expect the industrial and logistics sector likely to absorb in excess 40 million sq. ft. and supply in excess of 45 million sq. ft in 2023”. Srinivas N, Managing Director, Industrial and Logistics, Savills India.
The manufacturing sector has gained momentum due to increased activity, supported by various incentive schemes. As a result, the manufacturing sector’s contribution to overall absorption has consistently increased. In Q3 2023, the manufacturing sector was the driving force behind the overall demand, accounting for 33% of the total absorption. This trend is likely to continue, with a projected contribution in excess of 30% to the total absorption in the next two years.
The 3PL sector followed closely behind the manufacturing sector, accounting for 32% contribution to total absorption in Q3 2023. The other sectors contributing to the demand are retail at 16% and FMCD/FMCG at 5%. The others including cold storage, chemical storage, FTWZs, ICDs, and Urban Warehousing contribution around 11%.
Q3 2023 city wise absorption (%)
| Supply (%) | Absorption (%) | |
| Ahmedabad | 1% | 3% |
| Bangalore | 7% | 11% |
| Chennai | 8% | 11% |
| Hyderabad | 6% | 4% |
| Kolkata | 6% | 8% |
| Mumbai | 12% | 12% |
| Delhi-NCR | 31% | 14% |
| Pune | 8% | 14% |
| Tier II & III Cities | 21% | 22% |
In Q3 2023, Delhi-NCR remained at the top with the highest contribution of 31% to total supply, closely followed by Mumbai with 12%. Chennai and Bengaluru witnessed a contribution of 8% and 7%, respectively to total supply and tier II and Tier III cities together accounted for 21% of the total supply. In terms of absorption, Delhi-NCR and Pune each accounted for the highest contribution of 14% each in Q3 2023, followed by Mumbai at 12%, and Bengaluru and Chennai, each at 11%.
 Join our WhatsApp channel for more updates:
 Subscribe to our YouTube channel for more updates: