




Summary
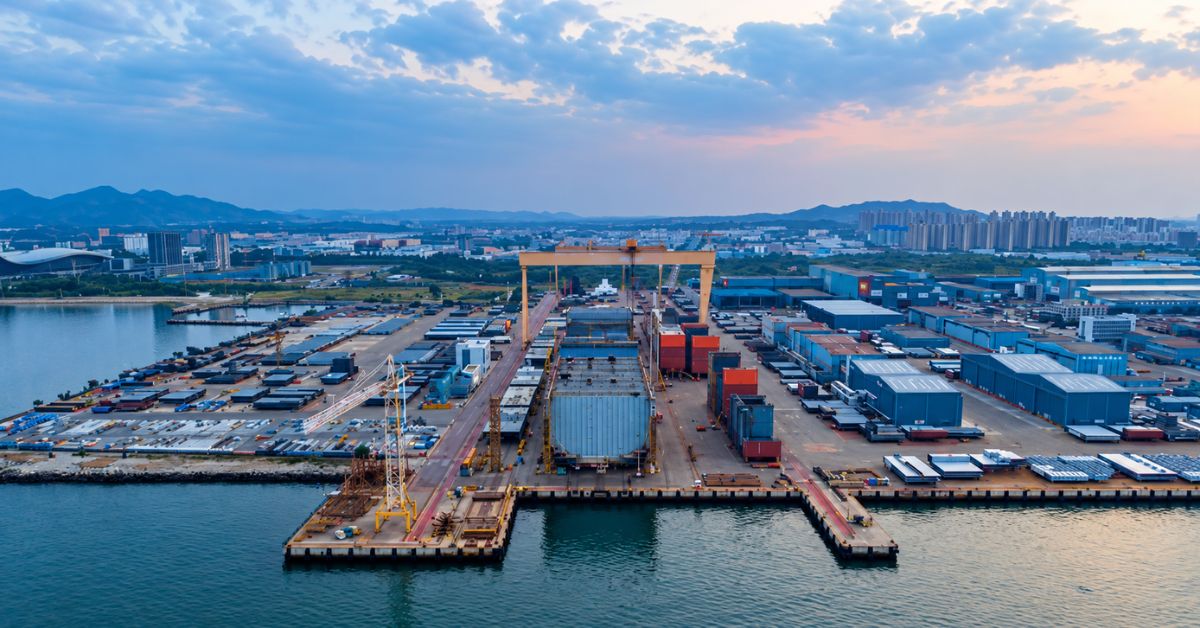
The global shipyard orderbook reached 203.2 million compensated gross tonnes at the start of September 2026, up 13% year on year. Chinese yards hold 64% of outstanding work, but their scheduled deliveries require a substantial production increase, raising questions about execution capacity and the longer-term risk of surplus shipbuilding capacity.
Outstanding orders remain near historic highs
The global shipyard orderbook stood at an estimated 203.2 million compensated gross tonnes, or CGT, on 1 September 2026, compared with 180 million CGT a year earlier, according to BIMCO.
The figures point to a substantial pipeline of contracted construction work. They measure orders awaiting delivery, rather than ships already completed or new contracts signed during September.
The orderbook remains below its May peak of 210.4 million CGT, although it exceeds the previous 2008 record of 195.4 million CGT.
That combination gives shipbuilders considerable forward work while placing greater importance on their ability to deliver contracted vessels on schedule.
China captures most recent contracting
Chinese shipyards secured 74% of new contracting measured in CGT during the preceding twelve months.
Their share of the outstanding global orderbook now stands at 64%, compared with 19% for South Korea and 6% for Japan.
Containerships are central to the expansion. They represent 30% of CGT on order and accounted for 68% of the orderbook’s increase over the year.
The figures distinguish two related developments: China has strengthened its position in construction contracts, while container shipping has supplied much of the additional workload.
For owners, this concentration makes delivery planning and individual-yard assessment increasingly important. A country’s aggregate orderbook does not establish the availability, technical capability or execution record of every builder operating within it.
Delivery schedules require higher production
The central challenge is converting outstanding contracts into completed vessels.
China, South Korea and Japan collectively delivered 40.1 million CGT in 2025. Their scheduled deliveries rise to 55.9 million CGT in 2027 and 60 million CGT in 2028.
China’s scheduled 2028 output alone reaches 44 million CGT, against 22.7 million CGT delivered in 2025.
These are scheduled construction volumes, rather than confirmed future completions. Meeting them requires output to rise substantially, particularly at Chinese yards.
BIMCO’s analysis also highlights the risk accompanying that expansion: facilities developed to fulfil today’s contracts could face lower utilisation if future ordering weakens.
Capacity coverage depends on the benchmark
Estimates of how many years of work yards hold depend on the capacity assumption used.
Using each yard’s highest annual CGT output during 2021–2025, Chinese builders have average order coverage of 4.2 years. The corresponding figures are 1.9 years for South Korea and 1.7 years for Japan.
If capacity instead reflects the highest annual output delivered or scheduled during 2021–2030, coverage falls to 2.1 years in China and 1.6 years in both competing countries.
The alternative calculation incorporates higher future production. It illustrates why a large backlog can indicate both strong commercial demand and a need to expand delivery capability.
CGT measures construction workload
Compensated gross tonnage allows comparison between vessels requiring different amounts of construction work.
It adjusts for ship type and size, helping analysts compare shipbuilding activity more meaningfully than a simple vessel count. A small, technically demanding vessel and a larger, simpler ship place different requirements on a yard.
CGT should therefore be distinguished from deadweight tonnage, cargo capacity and contract value. Growth in the measure indicates additional construction workload; it does not directly quantify the freight capacity that will enter service.
Supplier capacity matters alongside yard expansion
The production challenge extends beyond assembly facilities. OECD analysis describes shipbuilding as an industry dependent on interconnected engineering, equipment and materials suppliers.
Intermediate inputs, including marine equipment, steel and coatings, account for around 70–80% of final output value. Expanding delivery capacity consequently involves a wider industrial network.
The OECD also identifies weaknesses in comparable workforce, productivity and technology data, which can make emerging skills shortages and investment requirements harder to assess.
For shipbuilders and their suppliers, the current orderbook creates opportunities to secure sustained work. The commercial test is whether facilities, equipment deliveries and skilled labour can expand together while remaining competitive after the present construction pipeline begins to diminish.
FAQs
How large is the global shipyard orderbook?
It reached an estimated 203.2 million CGT on 1 September 2026.
Which country holds the largest share?
China, with 64% of the global orderbook.
Which vessel segment contributed most to growth?
Containerships accounted for 68% of the increase over the preceding year.
What does CGT measure?
It measures shipbuilding workload, accounting for differences in vessel type and size.
Are scheduled deliveries guaranteed completions?
No. They represent planned delivery volumes and depend on successful construction and execution.
 Join our WhatsApp channel for more updates:
 Subscribe to our YouTube channel for more updates: