




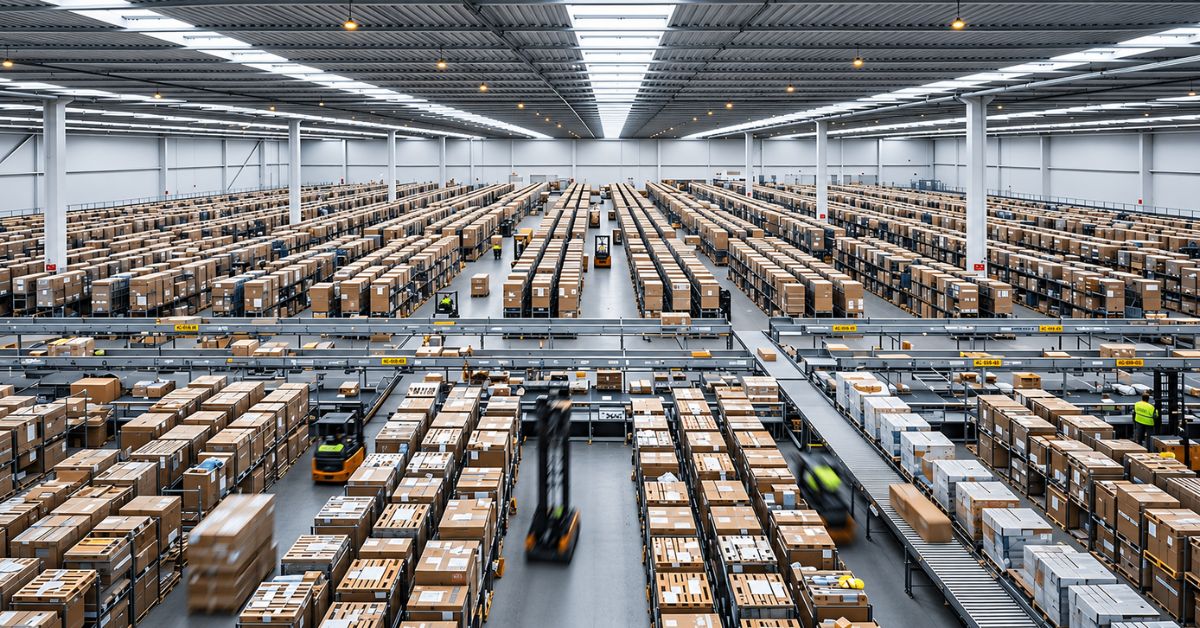

India’s warehousing and logistics market recorded 32.6 million square feet of absorption during January–September 2026, its strongest nine-month performance in three years, according to Vestian research released on 3 November.
Third-quarter absorption reached 10.58 million sq ft, increasing 15% year-on-year and 0.2% from the preceding quarter. The findings point to sustained demand for logistics space, with manufacturing and automotive occupiers contributing alongside third-party logistics operators.
Which industries are driving warehouse demand?
Third-party logistics (3PL) companies remained the largest occupier category, accounting for 29% of absorption in the July–September quarter. However, their share declined from 41% in the previous quarter as demand became more evenly distributed across industries.
Engineering and manufacturing contributed 23%, followed by automobiles and auto components at 14%.
Shrinivas Rao, chief executive officer of Vestian, said participation from manufacturing, automotive and other industrial businesses was broadening the sector’s demand base. He identified infrastructure improvements, policy support and India’s expanding consumption and manufacturing activity as factors supporting demand for modern warehouses.
Which cities led leasing activity?
Chennai ranked first with 2.89 million sq ft of absorption, supported by activity in Sriperumbudur and Thiruvallur. Mumbai followed with 2.70 million sq ft, while Pune recorded 2.20 million sq ft.
| Market | Q3 2026 absorption |
|---|---|
| Chennai | 2.89 million sq ft |
| Mumbai | 2.70 million sq ft |
| Pune | 2.20 million sq ft |
| National Capital Region | 1.27 million sq ft |
| Bengaluru | 0.71 million sq ft |
| Hyderabad | 0.68 million sq ft |
| Kolkata | 0.13 million sq ft |
Chennai’s absorption increased 320% quarter-on-quarter and 156% year-on-year. Mumbai’s volumes declined 46% sequentially and 37% annually, despite retaining second place.
Pune’s activity grew 245% year-on-year, with engineering and manufacturing occupiers supporting demand in Varale, Khed and Chakan. Bengaluru’s 445% annual increase reflected a low comparison base, while Kolkata recorded the lowest quarterly absorption among the seven markets.
How does the quarter compare with earlier trends?
Vestian’s first-quarter review recorded 11.4 million sq ft of absorption in January–March 2026. Mumbai and Pune together accounted for 81% of that total, demonstrating the concentration of activity in western India at the beginning of the year.
Third-party logistics companies held a 43% share in that quarter. Rentals across the seven tracked cities remained broadly stable, ranging from ₹20 to ₹29 per sq ft per month.
Against that earlier picture, Chennai’s third-quarter lead and the larger manufacturing contribution indicate a change in where leasing occurred and which businesses took space. The nine-month record reflects cumulative activity rather than a record for the third quarter alone.
What does the investment picture show?
Warehousing and logistics attracted $332 million in institutional investment during the third quarter, representing 17% of total quarterly real estate investment. Vestian identified this as the sector’s highest quarterly investment share in two years.
The wider policy framework also places emphasis on warehouse quality and operational efficiency. The government’s e-Handbook on Warehousing Standards provides guidance on physical infrastructure, space utilisation, health and sustainability.
According to the Ministry of Commerce and Industry, these standards are intended to support infrastructure improvements, technology adoption, cost reduction and investment. They form part of efforts to improve compatibility between logistics facilities and transport modes.
Vestian expects continued occupier demand to support modern, technology-enabled warehouses across established and emerging locations. Its latest figures nevertheless show substantial differences between cities, with national growth accompanied by declines in some individual markets.
 Join our WhatsApp channel for more updates:
 Subscribe to our YouTube channel for more updates: